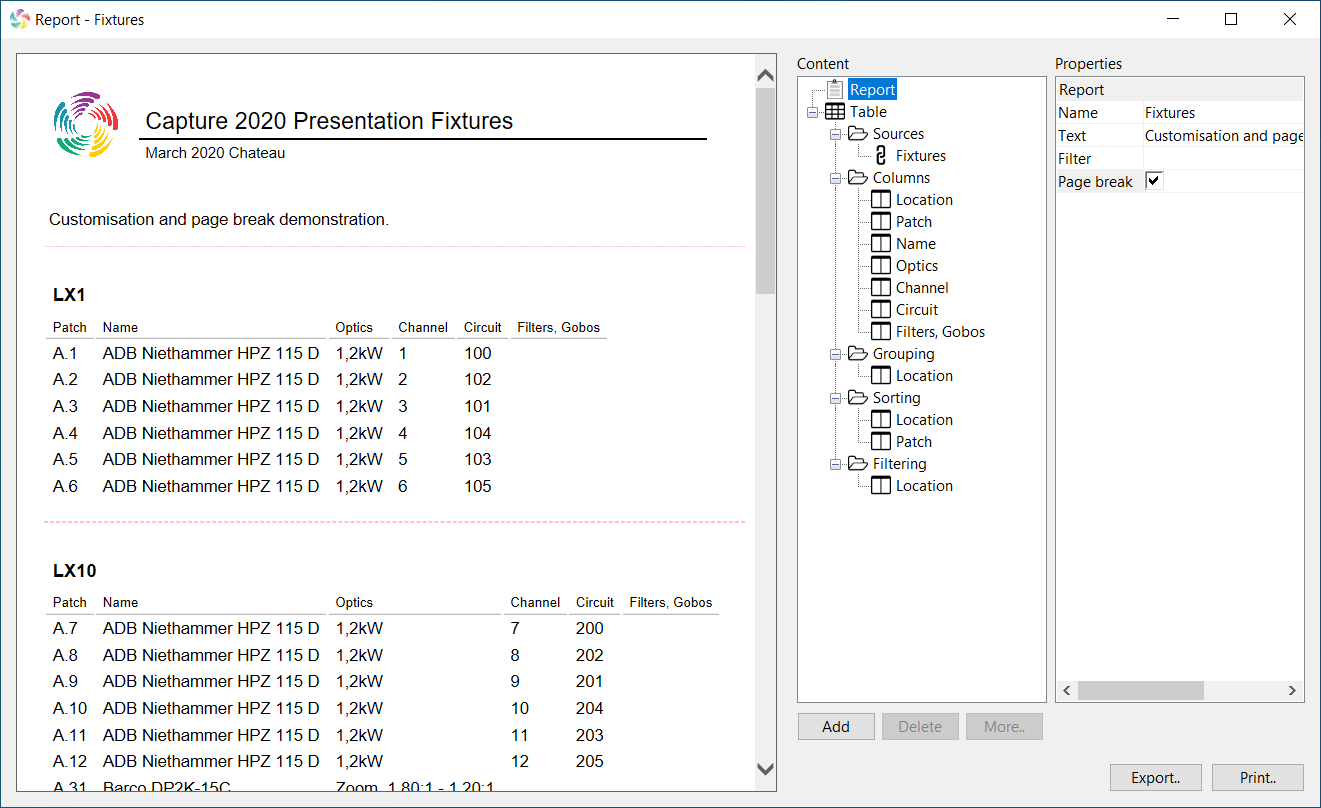
9 Report Editor

The report editor is opened using the Edit button in the Reports category in the Design Tab.
Reports are built up of Tables drawing data from various Sources. Each source contain some Columns which make out the contents of the tables. Each column can be optionally included in the Grouping, Sorting and Filtering of a table. Grouping causes a table to be split into multiple tables per individual value in the grouping column. Sorting causes the contents of a table to be sorted by the included columns. Filtering prevents any lines with no content in specific columns from being included.
The order of columns can be changed using the Move up and Move down commands which is available when a column is selected. Columns can be removed using the Delete button.
Columns can be added to grouping, sorting and filtering using the Add to grouping, Add to sorting and Add to filtering commands that are available when a column in Columns is selected.
Tables can be added and removed from the report using the Add buttons. When adding a table, one or more sources and one or more columns from these sources need to be selected.
Additional sources can be added to an existing table using the Add sources command which is available when Sources is selected. Additional columns from a table’s sources can be added using the Add columns command which is available when Columns is selected.
The Export button exports a report to HTML for distribution or editing in other software. The Print button prints the report.
9.1 Report Properties
The Name and Text properties are included in the contents of the report.
Use the Filter property as a means of choosing what project content to include in the report. See Filters for more information on filters.
When the Page break property is checked a page break is included before every table, ensuring that each new tables starts on a new page when printed. Page breaks are indicated with red dashed lines in the report view.